
Thinking in Points
Consider this little plot generated by python.
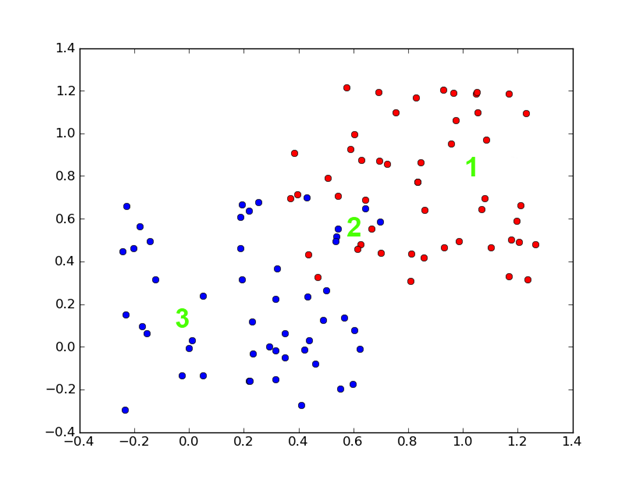
There are a series of example points (blue and red) along with three test points (green x). Consider the following question:
If you were to guess the color of 3 new points (1, 2, and 3) what would your guess be?
Instinctively we guess 1 belongs to the red class and 3 belongs to the blue class. 2 seems to be a toss-up. How did we come up with this?
Separators
I am guessing that we instinctively made a fake line through the points and decided that everything to the left of the line has to be blue and everything to the right of the line has to be red.
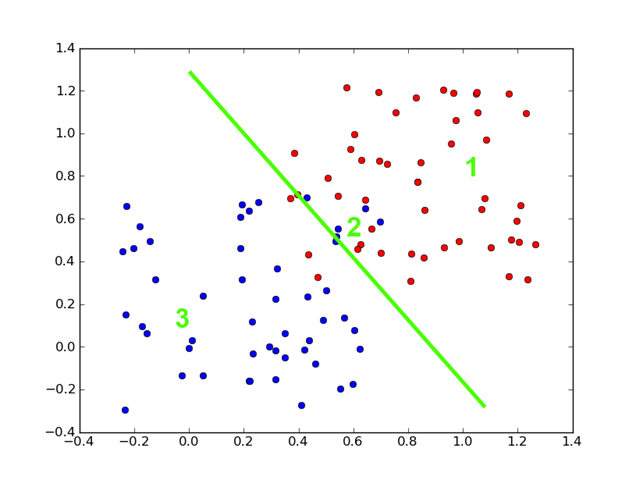
This line separates the data into two distinct classes (red and blue). Notice that in this case (if we were “strict” in our adherence to the separator, we would make some mistakes: even with the example points. Using this separator we would misclassify 3 or four red points as well as 4-ish blue points.
Generalization
Here then is the point. Given the examples, we came up with a line to represent the entire problem of separating blue and red points using their respective coordinates. In this case each example had two features (x and y coordinates) and a single label (red or blue). With these we generalized the problem into a single line which would be used to make all future decisions.
Linearly Separable
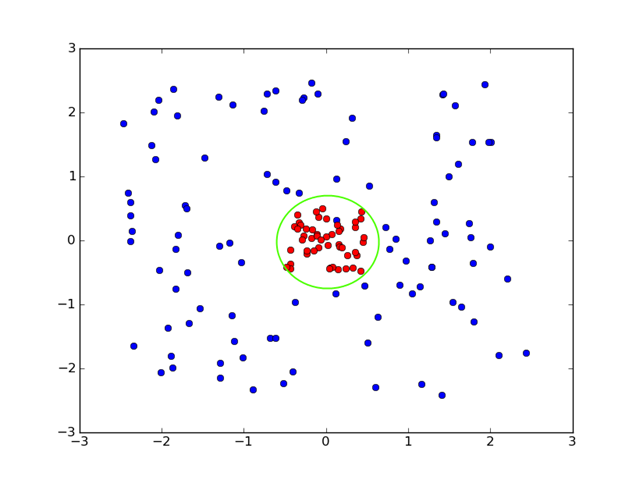
What happens if our problem looks like this:
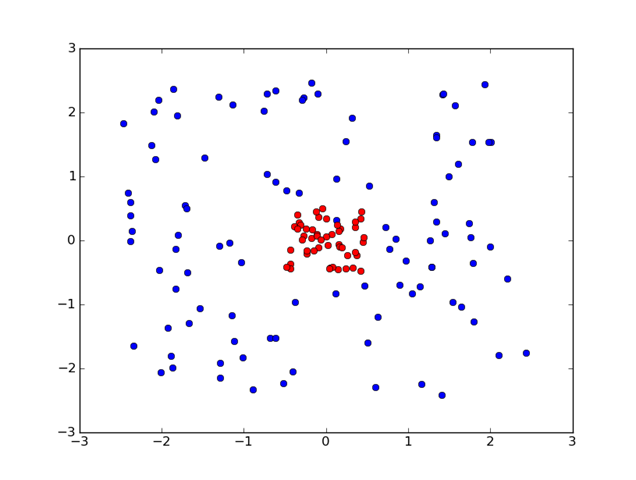
Notice that there is no line that will properly separate this data. Our linear model of binary classification kind of breaks down (kind of). Instinctively though, we could theoretically draw a circle around the red points and then say everything inside the circle is red and everything out of it is blue.
Tricks
In this particular case, we can trick it into being linearly separable. Let's do the following: take each (x, y) pair and make it 3d by plotting (x2, y2, x * y). This is what it looks like:
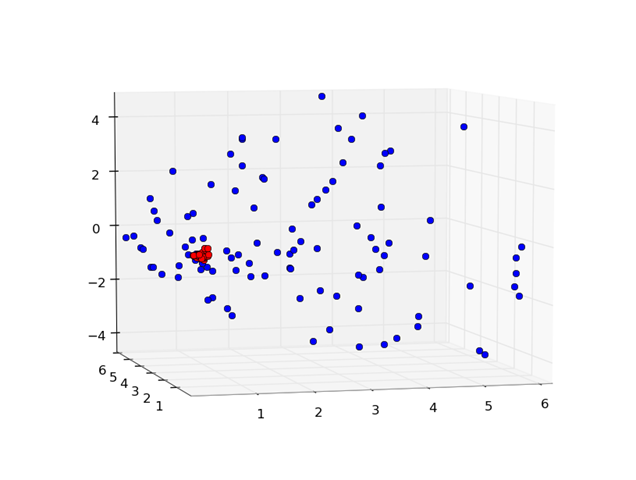
Shifting the same image to the left a little:
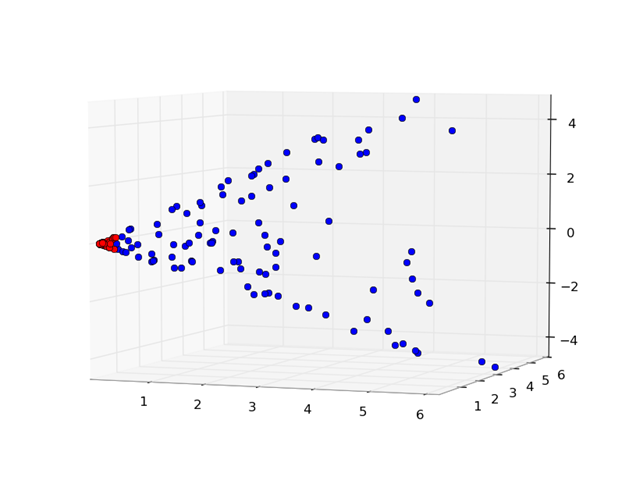
In this case we can separate the blue's and red's using a plane (which is also linear). When we squish it back down to 2d, we get a funny linear separator generated from a projection from 2d space to 3d space and then back down:
A circle!
In Summary
The main idea of this post is getting us to think about how humans think about separating things (in our case binary classification). If we can project our instincts into math, then we can make algorithms learn (or generalize) from data just like we do. The machine learning library I am building is an attempt to abstract the math behind it. The question now becomes: how can we change our object oriented examples into x and y?
Addendum
I thought it would be nice to include the python code (remebering that these points are randomly generated so they will be slightly different than my diagrams).
from numpy import *
from pylab import *
import mpl_toolkits.mplot3d.axes3d as p3

# Linearly Separable
def exampleGraph():
	X1 = rand(50,2) + .3
	X2 = rand(50,2) - .3
	plot(X1[:,0], X1[:,1], 'ro', X2[:,0], X2[:,1], 'bo')
	show()
	return X1, X2

# Not linearly separable (using squared features)
def exampleGraph2():
	X1 = (rand(100,2) - .5) * 5
	X2 = (rand(50,2) - .5)
	plot(X1[:,0], X1[:,1], 'bo', X2[:,0], X2[:,1], 'ro')
	show()
	# 3d stuff
	a = vstack([X1[:,0] ** 2, X1[:,1] ** 2, X1[:,0] * X1[:,1]]).T
	b = vstack([X2[:,0] ** 2, X2[:,1] ** 2, X2[:,0] * X2[:,1]]).T
	fig = figure()
	ax = p3.Axes3D(fig)
	ax.plot(a[:,0], a[:,1], a[:,2], 'bo')
	ax.plot(b[:,0], b[:,1], b[:,2], 'ro')
	show()
	return X1, X2
Your Thoughts?
- Does it make sense?
- Did it help you solve a problem?
- Were you looking for something else?