
Purpose
In previous posts, I started creating an html grid helper that was really just an experiment to see how one would accomplish such a thing. Here, I wanted to delve into a more generic approach to creating html controls for the ASP.NET MVC paradigm that would accomplish the following:
- be highly interactive on the client side, while
- minimizing the client-server interaction
With tools like jQuery among others, #1 is quite easy to accomplish. But how do we go about accomplishing #2? I have seen custom controls that generate an AJAX call to the server every time something happens in the control. Imagine a setting like a gradebook (we are doing this currently where I work) where the user clicks on a cell in a table to denote whether or not a student was absent on a particular day. If I was to generate an AJAX request for each click, the control would not be very useful (at best it would be slow). What if the control were smart enough to keep track of itself and then send back only changes? This would certainly accomplish #2. In the next few posts, I will go through some of the steps that led me to a solution that seems to work. I am hoping that you, dear reader, will assist me along the way with anything I might have missed, omitted, or simply screwed up.
Debugging
When I first started, I found out quickly that I needed a way to see what was happening when the user was interacting with my controls. I know such things exist! Firebug is God's gift to every web developer! In our setting, however, we are required to make it work in IE (along with every other browser that has not been bestowed with the excellence known as Firebug). I also know that in IE 8 there are some pretty spiffy developer tools. But... These tools were way more than I needed/wanted. I just wanted a simple way to print out things as events were fired off. Something like:
$(document).ready(function(){
	var clickNo = 0;
	$('#Main td').click(function(){
		if(window.isDebug)
			_(this.id).write('Click # ' + (++clickNo));
	});
});
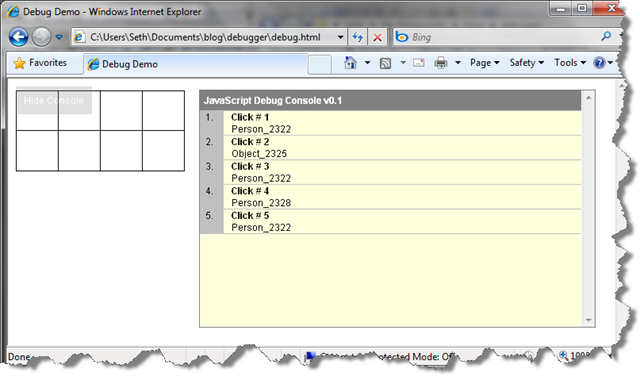
Notice the simplicity of lines 4 and 5. If JavaScript is in debug mode, put an object in a jQuery like constructor and write out the value along with a title (to keep me sane). I made a debugger like that at work, but as any self-respecting developer, I wanted to make it better. The JavaScript above, simply captures a user's click on a table cell and if the browser is in debug mode, writes out the id of the td element that was clicked along with a special message. Here is what it does:
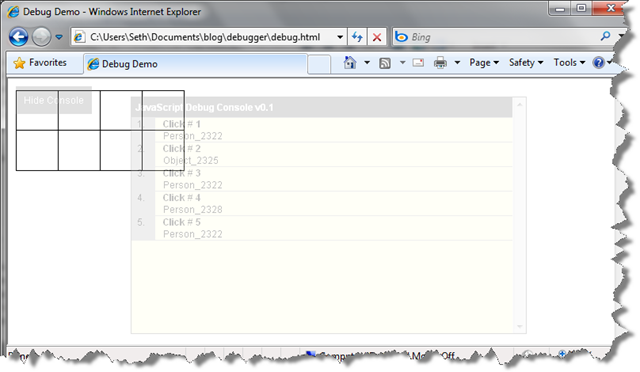
Having a huge box like that could get annoying, so I made it draggable and changed the opacity of the console when the mouse moved off of the debug console:
This proved extremely helpful when debugging! I love the way jQuery works so I decided to mimic its general constructs in my debugger. As you can see, it certainly is no Firebug, but it is powerful enough to provide the kind of information needed when building complex client-side html controls.
Where Next?
In the next installment, I will beef up the debugger so that it does more than print JavaScript strings. If this is going to be of any use, it will need to print out complex JavaScript objects (like arrays) in a meaningful way. This should not be difficult to accomplish since the for(x in obj) construction allows us to actually perform some introspection (or reflection in C#) on any JavaScript object. This along with the typeof operator should be sufficient to meet our goal.
Your Thoughts?
- Does it make sense?
- Did it help you solve a problem?
- Were you looking for something else?